


Our consulting team can assist with four levels of reporting within Penelope.
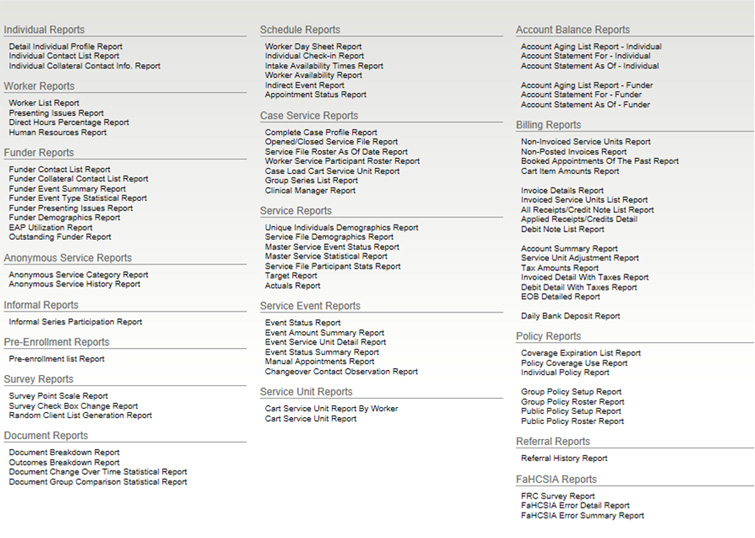
The first level is within the Penelope client which provides you with access to almost 100 reports providing you with information about your clients, workers, waiting lists, invoicing etc. We can provide you with training to maximize the benefits of the reports within Penelope in your organization on a day-to-day basis.
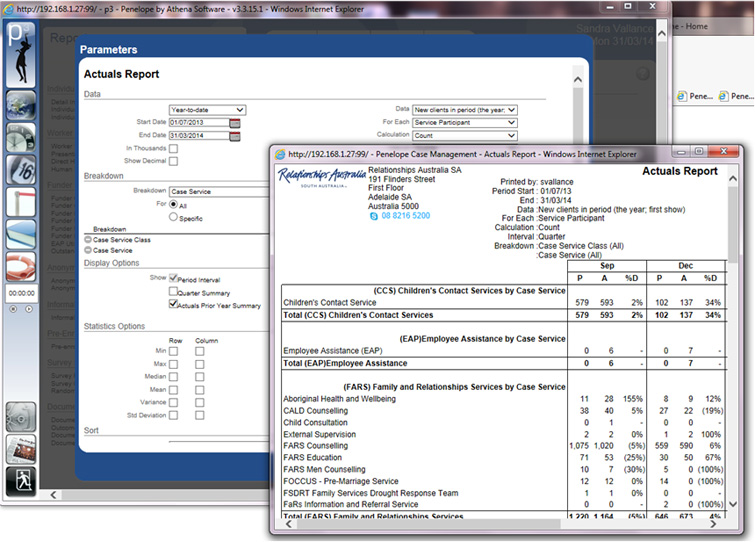
The next level of reporting within Penelope is the Actuals Report which provides flexible breakdown reporting for your case services.
The third level of reporting within Penelope is to use the ODBC connector and the Athena developed views of your Penelope data.
Please register for a Penelope ODBC Connection and Pivot Tables Workshop to maximize your use of this valuable resource. The purpose of this workshop is to provide you with basic skills to connect to the Penelope database using ODBC, extract views of Penelope data and create pivot tables to present Penelope data. Penelope Excellence sets the goal of flexible reporting and data analysis to meet team leader, executive and funder requirements.
The fourth level of reporting is a range of reporting tools that the Penelope Excellence Consulting team has developed to simplify regular management reporting. The reporting tool includes:
The Program Statistical reporting tool
The Program Statistical reporting tool which provides you with the opportunity to see at how level how your services are collectively or individually performing across the organization, by region or site over the timeframe that you have been using Penelope. You can view new client counts, existing clients, registered and unregistered clients and statistics for clients that use services managed through the Informal Series and Anonymous Services functionality within Penelope.
Please view this video for a demonstration of the Program Statistical reporting tool:
[do action=”vimeo” vimeoid=”96037313″/]
The Practitioner Statistical reporting tool
The Practitioner Statistical reporting tool provides the manager and team leader with a snapshot of how there staff members are performing in the roles. The tool provides a snapshot view of client count by service, level of group work, how much time the staff member is spending in contact with clients and on non-contact work, and the hygiene of their Penelope data (ie that they are ensuring that their client data is correct and up to date).
Please view this video for a demonstration of the Practitioner Statistical reporting tool:
[do action=”vimeo” vimeoid=”96037311″/]
The Presenting Needs and Flexible Demographics Reporting tool
The Presenting Needs and Flexible Demographics Reporting tool which allows managers to ask a range of questions of Penelope about clients, services, presenting needs, needs addressed etc.
Please view this video for a demonstration of the Presenting Needs and Flexible Demographics reporting tool:
[do action=”vimeo” vimeoid=”96037312″/]
With each of the three above reporting tools, we provide:
- The reporting tool
- Online training which includes videos and a manual
- The option of an online workshop
- One hour of consulting to embed the tool in your Penelope environment
Whatever your requirement, we can help you to make sure that your own report requirements are met in the most efficient and effective way with the Penelope Software Systems varied reporting options.
If you are interested in more information about the Penelope Reporting Suite, please submit an enquiry using the form below.
Consulting Enquiry
Use this form to enquire about our Consulting services.